
Guides · 08
Satellite Image Comparison: What Changes Can You See?
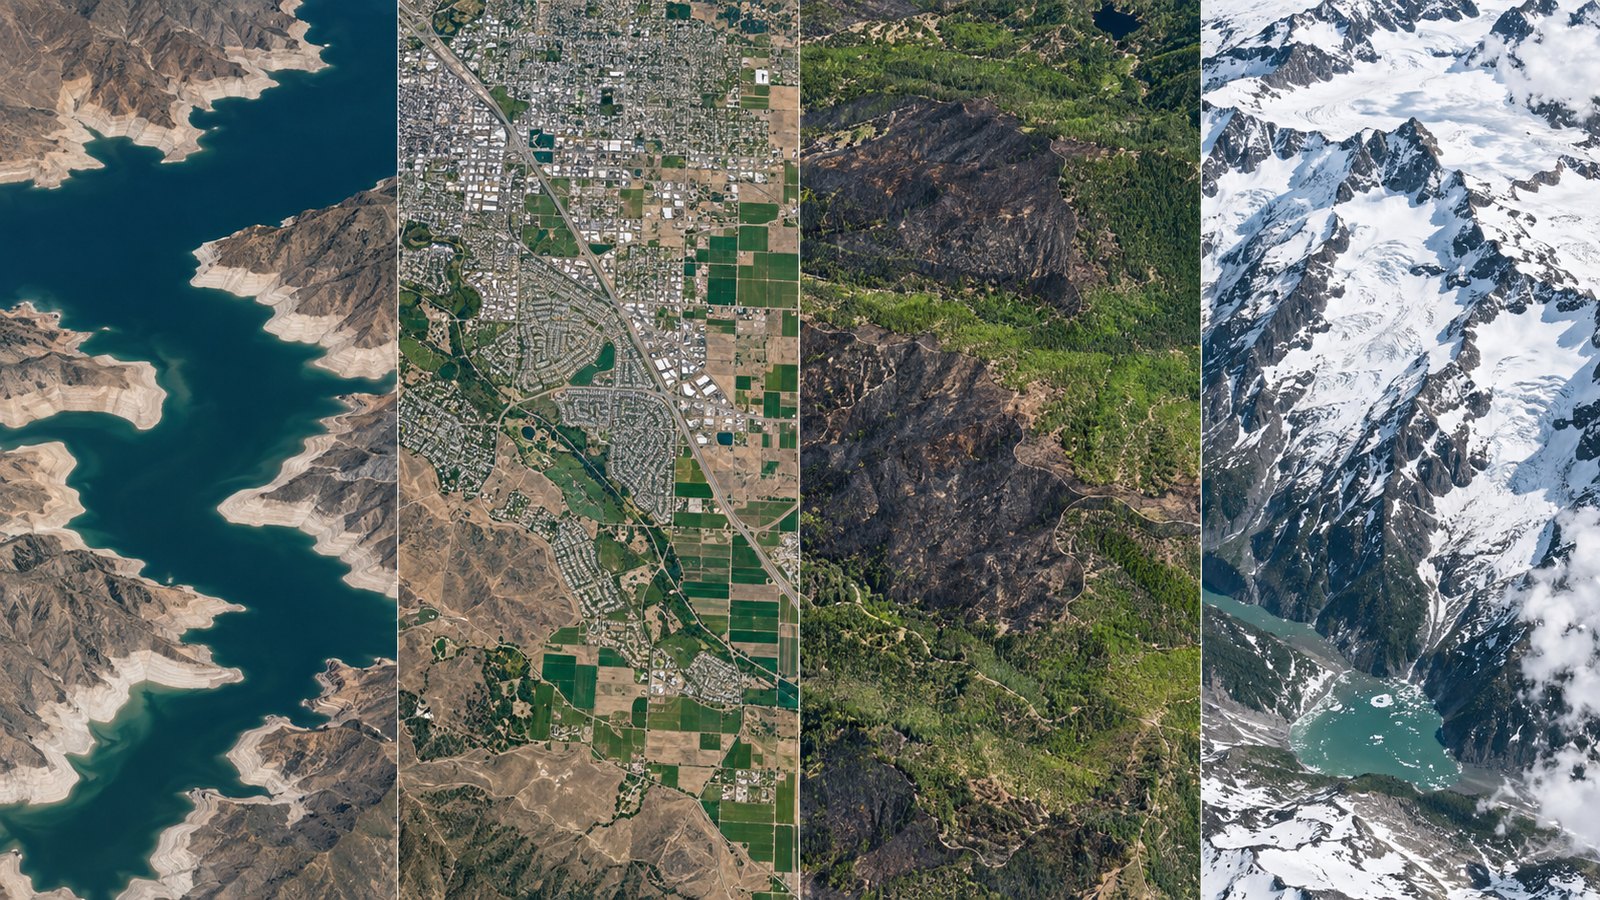
A two-date satellite comparison can reveal broad visible differences such as shoreline position, large construction areas, burn scars, snow cover, vegetation seasonality or missing water. It cannot by itself prove the cause, measure physical change, resolve fine property detail or distinguish real change from clouds, illumination and processing.
Updated:On this page
Look for changes larger than the pixelsSeparate persistent features from temporary appearanceDescribe what is visible before explaining whyTreat color carefullyKnow the boundary between comparison and measurementBuild a responsible captionLook for changes larger than the pixels
HLS browse imagery is derived from 30 m pixels, so broad patterns are more credible than thin lines or individual objects. Start with coastlines, reservoirs, large fields, urban edges and major disturbance areas. Zooming the display does not create finer detail in the original data.
Separate persistent features from temporary appearance
A difference seen on one pair may be cloud, haze, snow, floodwater, crop season or sun angle. Check neighboring dates and similar seasons before calling it persistent. If the signal disappears immediately, describe it as an observation to investigate.
Describe what is visible before explaining why
Write “the visible water boundary is farther inward” before “the lake lost water because of drought.” Causal statements need hydrology, weather, management and other evidence. Neutral descriptions make the comparison useful even when the cause is unresolved.
Treat color carefully
True-color browse layers can still vary with atmosphere, illumination and processing. False-color products deliberately map non-visible bands into visible colors. Do not calculate vegetation health, burn severity or material type from screenshot colors.
Know the boundary between comparison and measurement
The tool aligns a shared visual frame and exports images. It does not classify pixels, correct atmosphere, compute area, calibrate reflectance or establish legal boundaries. Use original data and a GIS or remote-sensing workflow for quantitative questions.
Build a responsible caption
State place, product, both UTC data dates, visible feature, cloud or coverage caveats and NASA attribution. Avoid certainty words when the evidence is only visual. Link to the share state or source documentation so another reader can repeat the inspection.
Questions before you begin
Can satellite images show a new building?
A very large development footprint may be visible, but an individual building is often too small or ambiguous at 30 m.
Can I prove deforestation with two screenshots?
No. Screenshots can flag a visible difference; proof requires suitable original data, classification, validation and context.
Why did vegetation color change?
Season, moisture, atmosphere, illumination, sensor processing or real vegetation change may contribute.
Is a checkerboard gap a land change?
No. It represents missing or transparent imagery, not a surface condition.
Sources & further reading
Use the tool as a first step
Build an attributed visual pair, then use original data and an analysis workflow for quantitative claims.